Picking a credit card in Bangladesh is weirdly hard. Not because there aren’t options — there are 257 of them across 49 banks — but because the information you need to choose well is scattered across dozens of “Schedule of Charges” PDFs, each formatted differently, half of them scanned, some of them mixing Bengali and English in the same table.
I decided to collect all of it, clean it, and put it in one place — cardcompare.bd — where you can compare cards side by side. Here’s how the machine that does it actually works — and a few of the moments where it nearly fooled me.
Step 1: Find the source of truth
Every bank publishes a Schedule of Charges (SOC) — the legal document listing every fee, rate, and benefit for each card. That document is the only thing I trust. Not blog posts, not aggregators, not marketing pages. If a number can’t be traced back to a bank’s own SOC, it doesn’t go in.
So the pipeline starts with a search — using DuckDuckGo, scoped to each bank’s own domain — to locate that official document. A hit only counts if it’s on the bank’s domain, actually covers credit cards, and shows an effective date. Some banks turned out to issue no credit card at all; They are noted in the system and removed from the upcoming pipeline.
Step 2: Capture everything into a secure folder
Once a source is found, I download it — PDF, web page, or image — into a controlled folder. This matters more than it sounds. Sources move, get replaced, or vanish behind bot-walls (more on that later). Snapshotting the exact bytes I read means every number I publish can be re-checked against the precise document it came from. This also keeps a record of where i sourced my data vs what exists in the website now. Each Document goes through a hash-check as well. SHA1, i know, not secure enough but for this case, thats okay.
Step 3: Read it — and the format dictates the tool
This is where one size very much does not fit all, because banks publish in three completely different ways:
- Text PDFs → run through Microsoft’s MarkItDown to convert the document (and its tables) into clean Markdown.
- Scanned/image PDFs → there’s no text to extract, just pixels. These go to a vision-capable model that reads the page the way a person would.
- Web pages → rendered with Playwright (a headless browser) and extracted to text, because the important data sometimes lives in JavaScript-driven tables that a simple fetch never sees.
The output of all three paths is the same: raw data in a human-readable Markdown file. One messy input format in, one consistent format out.
War story #1 — the scanned tables. A surprising number of “PDFs” are just photographs of a printout. One bank’s entire SOC was a single landscape image with eleven card columns in tiny Bengali numerals. Render it too large and the vision model chokes; too small and the digits blur. The fix was rendering each page at a controlled resolution and slicing it into readable strips — a small engineering detail that’s the difference between correct fees and confident nonsense.
Step 4: Verify the raw data against the source
Here’s the part that i initially skipped, and it’s the part that makes the whole thing trustworthy.
Before any cleaning happens, smaller agent models re-check the extracted Markdown against the original document — field by field, row by row — looking for anything missing, swapped, or misread. Only data that survives this pass moves forward. Anything that doesn’t, goes back for reprocessing.
Why be this paranoid? Because “official” does not mean “easy to read correctly.”
War story #2 — the ৳500 that wasn’t. One bank’s card-replacement fee came out as a flat ৳500 across every tier. Looked clean. It was wrong: ৳500 was the PIN-replacement row sitting directly above it, and the extraction had grabbed the wrong line. The real replacement fees were tiered — ৳1,000 and ৳1,200. Pulling that single thread revealed that the late-payment, over-limit, and several annual fees on that bank were off too. One misaligned row, a dozen wrong numbers. This is exactly the failure the verification step exists to catch — anchor every value to both its row label and its column header, or don’t trust it.
War story #3 — the wrong column entirely. Another bank’s SOC listed two sets of fees side by side: one for bank staff, one for the general public. The first extraction read the staff discount column. Verification flagged it, and ten fields got corrected to the rates a normal customer actually pays.
The rule the whole system runs on: never guess. If the document doesn’t say it, the value is null — not zero, not a sensible-looking default, not a number copied from a similar card.
Step 5: Clean and de-jargon
Once the raw data is verified, a separate agent takes over to clean it: strip the legal boilerplate, normalize the wording, and — critically — throw out everything that isn’t a credit card.
That last bit is harder than it sounds, because SOC documents love to mix card types in one shared table. Credit, debit, prepaid, gift, and Hajj cards often share columns, and a fee from a prepaid column silently attaching itself to a credit card is the single most common way these datasets get quietly corrupted. The cleaner’s job is to make sure every value sits under a genuine credit-card column before it survives.
Step 6: Turn each document into structured JSON
The cleaned data becomes a JSON file paired one-to-one with each source Markdown file. Every fee, rate, benefit, and footnote in the official document gets a field. Nothing the bank published is dropped — if there’s no existing field for something unusual, it gets proposed as a new one rather than thrown away.
Step 7: Reconcile across banks — the hard, interesting part
Now the real intelligence kicks in. Forty-nine banks describe the same concepts in forty-nine different ways. One calls it “Late Payment Fee,” another “Penal Charge for Overdue,” a third frames it as a profit adjustment. An Islamic bank doesn’t charge interest at all — it charges a profit rate or a monthly maintenance fee, and treating those as the same field would be both wrong and a little offensive.
An LLM does the reconciliation: comparing fields across every provider and interpreting the same thing written differently. The output is split deliberately:
- Common, comparable fields (annual fee, interest rate, lounge access, FX markup…) go into a structured relational database — the stuff you actually filter and sort on.
- Uncommon, bank-specific quirks go into a JSONB object alongside the structured row — flexible storage for the one-off fees that don’t deserve their own column but shouldn’t be lost.
This is the bit that turns 49 incompatible documents into one comparable dataset.
A small, satisfying win. When the data first hit the site, the network filter showed
Visa,visa, andVISAas three separate options — the banks’ own inconsistent capitalization leaking straight through. One normalization pass collapsed them into a single cleanvisa. Unglamorous, but it’s the kind of thing that separates “a pile of data” from “a product.”
Step 8: Build the front end
The site is Astro with Svelte islands. At build time it reads the database and generates static pages for every bank and every card — fast, cache-friendly, no server doing work on each request. The interactive parts (filters, the side-by-side comparison engine that lets you put two cards head to head) are Svelte components hydrated only where needed.
Then it ships — live at cardcompare.bd.
Step 9: Keep it alive
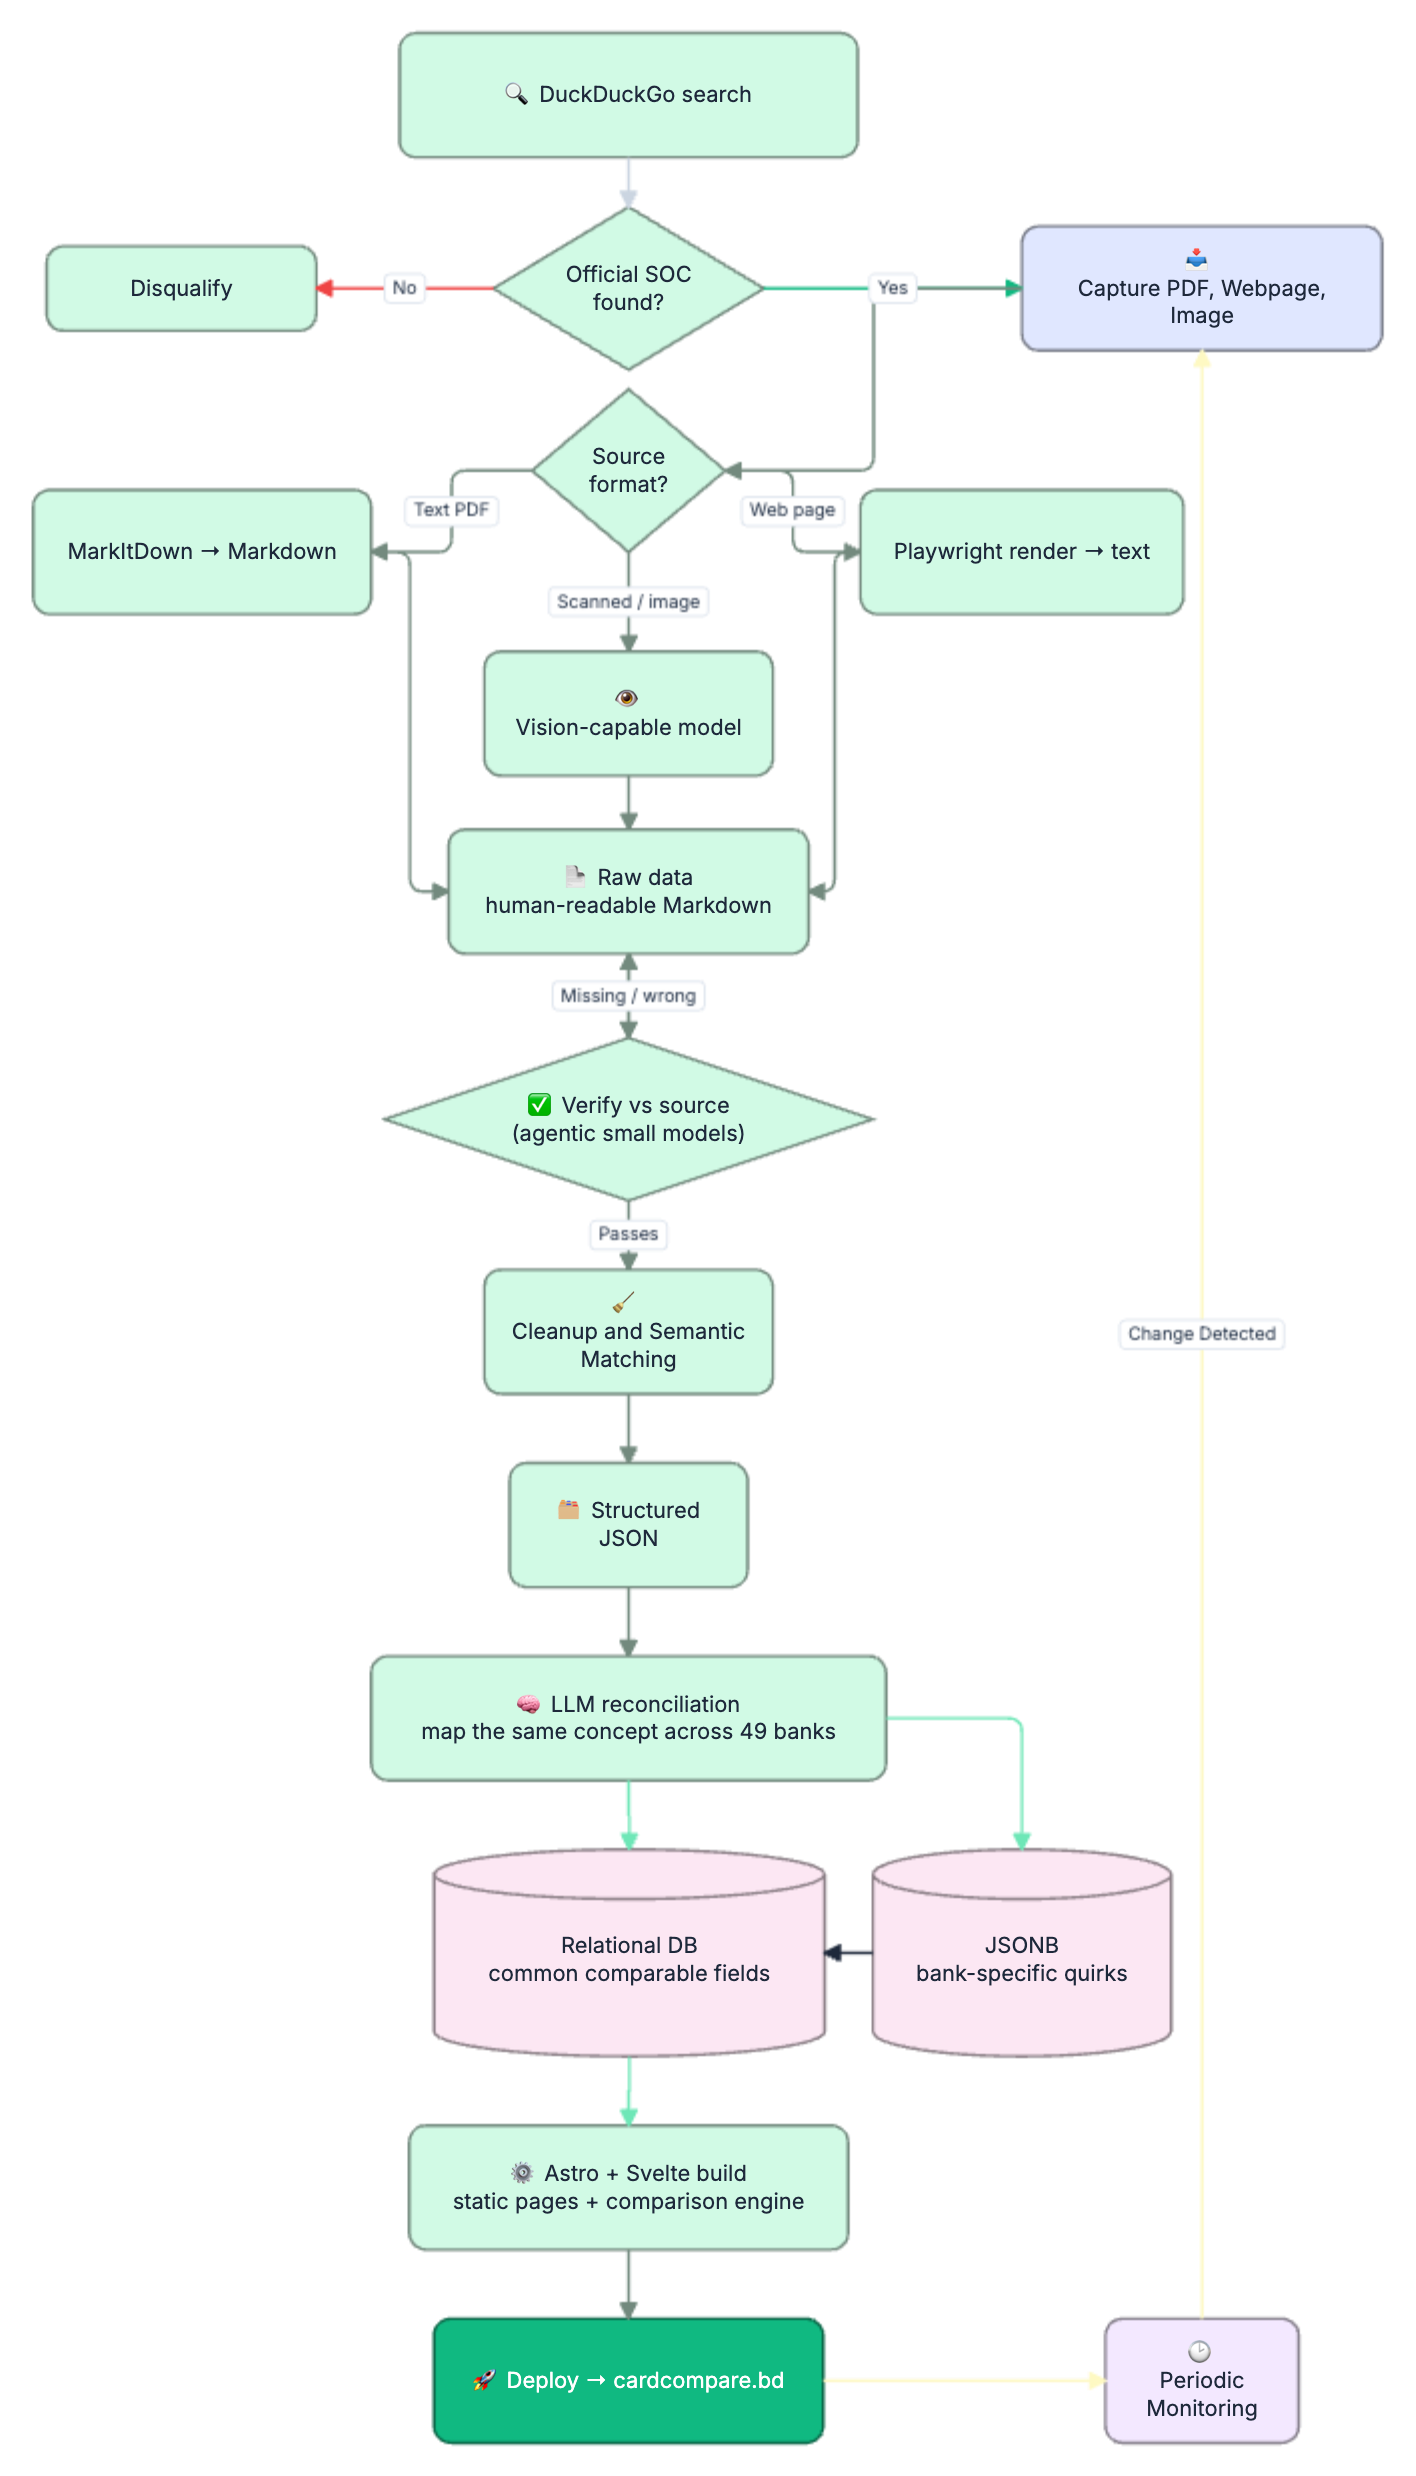
A dataset like this is only as good as its freshness — fees change, new cards launch, old ones retire. So the final piece is a monitoring pipeline that periodically re-checks each bank’s site for changes. When something moves, it runs the entire flow above automatically: find, capture, read, verify, clean, structure, reconcile, rebuild. The comparison stays current without a human babysitting it. But once it finds something got changed somewhere, it asks me for final confirmation as a PR to review. Once i merge the PR, the new data is in.
Full Flow Diagram
Why this was worth doing
The fun engineering problem here isn’t any single step — it’s that every step has to assume the previous one might be wrong. Banks publish in incompatible formats. Scanned tables hide swapped rows. Shared columns leak the wrong card type. “Official” sources are riddled with the kind of small errors that only surface when you line 49 of them up next to each other.
The payoff is simple: someone choosing a card gets to compare them honestly, in one place, with every number traceable back to the bank’s own document. That’s the whole point — and it’s a lot more pipeline than it looks from the outside.